Understanding the Analysis Dashboard
Learn how to navigate and interpret your schematic analysis results
Dashboard Overview
After uploading your schematic, the analysis dashboard provides a comprehensive overview of your design. Multiple AI models have analyzed your circuit, and the results are organized to help you quickly identify issues and improvements.
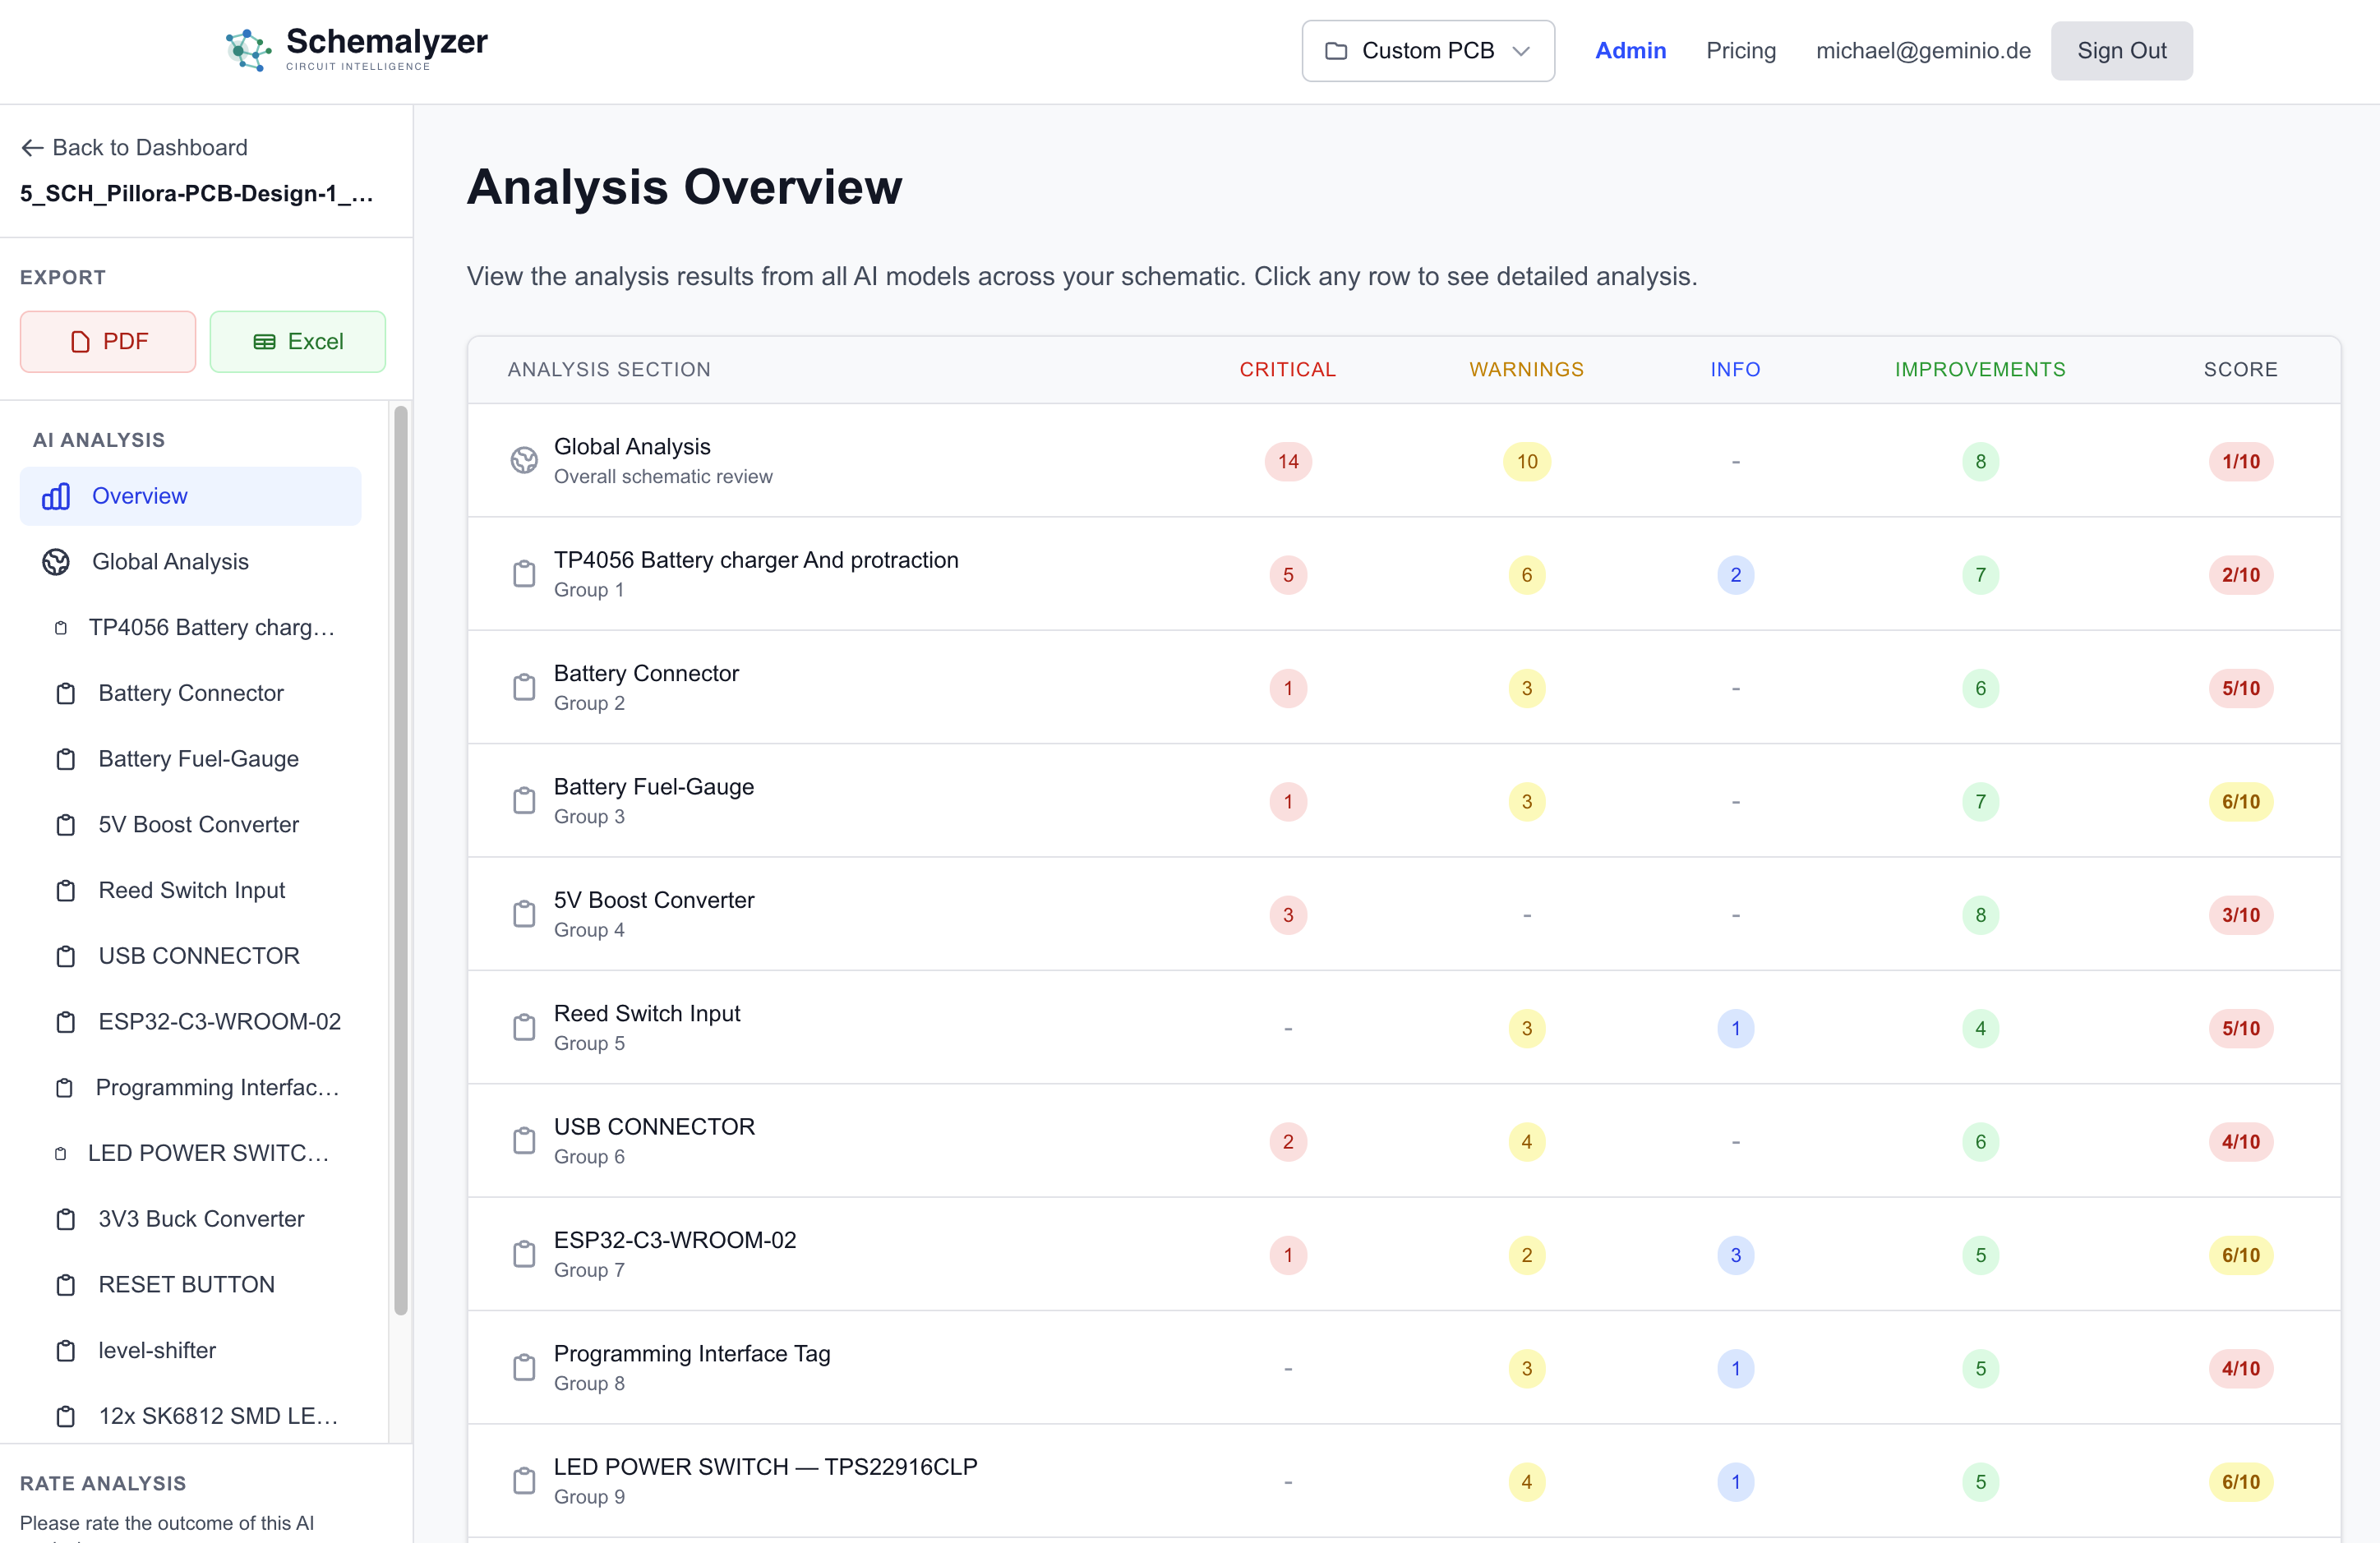
Analysis Overview Table
The main table shows analysis results organized by circuit groups. Each row represents either the global analysis or a specific functional group (like "Battery Charger" or "5V Boost Converter").
Understanding the Columns:
Issues that must be fixed before manufacturing (missing connections, wrong values, incompatible parts)
Potential problems that should be reviewed (unusual configurations, possible design flaws)
Informational notes about your design (component details, notable features)
Suggestions to enhance your design (alternative components, optimizations, best practices)
Overall design quality score (1-10 scale, higher is better)
Global Analysis vs Component Groups
The analysis is organized into two levels:
Global Analysis
The first row shows overall findings that apply to the entire schematic. This includes system-level observations, inter-group connections, and general design patterns.
Component Groups
Each subsequent row represents a functional group in your circuit (identified by rectangles or proximity in your schematic). The AI analyzes each group independently for specific issues.
Sidebar Navigation
The left sidebar provides quick access to different sections of your analysis:
Overview
The main table view (what you see when you first open the analysis)
Global Analysis
Detailed view of system-level findings
Component Groups
Click any group name to see detailed analysis for just that section
Understanding the Score
Each row has a score (1-10) that represents the overall quality of that section:
Excellent - Few or no issues, well-designed
Good - Minor issues or improvements suggested
Fair - Several warnings or design concerns
Needs Work - Critical issues that must be addressed
Note: The score is calculated based on the severity and number of issues. A low score doesn't mean your design is bad—it means the AI found areas that need attention.
Exporting Your Analysis
At the top of the sidebar, you'll find export buttons to save your analysis:
Download a formatted PDF report perfect for documentation or sharing with team members
Export to Excel for further analysis, filtering, or integration with your workflow
Viewing Detailed Analysis
Click on any row in the overview table to see the full detailed analysis for that section. This will show you:
- Complete descriptions of each issue, warning, and suggestion
- Specific component references and net connections involved
- AI reasoning and recommendations for fixes
- Links to relevant datasheets and documentation
Pro Tips
- Start by reviewing the Global Analysis to understand system-level issues
- Focus on CRITICAL issues first—these are blockers for manufacturing
- Use the IMPROVEMENTS column to learn best practices and optimize your design
- Export to PDF after you've reviewed everything to keep a record of the analysis